Vagrant supports three types of networks: public, private, and port-forwarding. The private network type has the option to use a UDP tunnel for a point-to-point link when using the vagrant-libvirt plugin. This connection type is ideal for links between virtual network devices.
Refer to the following resources if you need more information:
The only drawback with this type of connection is concerning packet sniffing. Since the connection uses a tunnel for encapsulation, we need a method to view the relevant data within the tunnel somehow.
Ingredients used for this post:
Vagrantfile
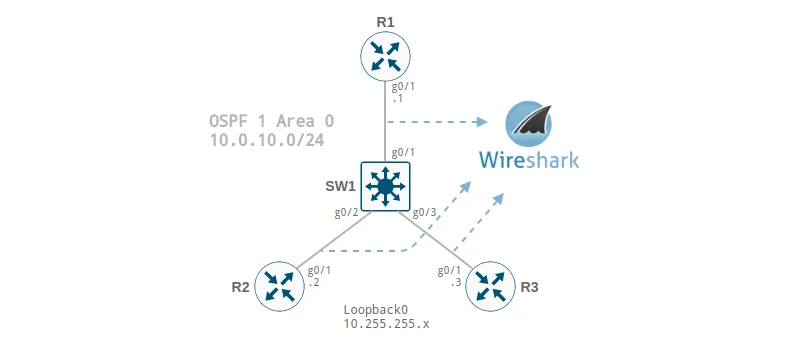
The network diagram is displayed at the top of this post, and our Vagrantfile contains the following:
# -*- mode: ruby -*-
# vi: set ft=ruby :

Vagrant.configure("2") do |config|
  config.vm.provider :libvirt do |lv|
    lv.suspend_mode = "managedsave"
  end

  config.vm.define "r1" do |node|
    node.vm.box = "cisco-iosv"
    node.vm.provider :libvirt do |domain|
      domain.management_network_mac = "52:54:00:10:d7:fc"
    end
    node.vm.network :private_network,
      :libvirt__iface_name => "g0/1",
      :libvirt__tunnel_type => "udp",
      :libvirt__tunnel_local_ip => "127.1.1.1",
      :libvirt__tunnel_local_port => "10001",
      :libvirt__tunnel_ip => "127.1.4.1",
      :libvirt__tunnel_port => "10001",
      auto_config: false
  end

  config.vm.define "r2" do |node|
    node.vm.box = "cisco-iosv"
    node.vm.provider :libvirt do |domain|
      domain.management_network_mac = "52:54:00:ef:62:0a"
    end
    node.vm.network :private_network,
      :libvirt__iface_name => "g0/1",
      :libvirt__tunnel_type => "udp",
      :libvirt__tunnel_local_ip => "127.1.2.1",
      :libvirt__tunnel_local_port => "10001",
      :libvirt__tunnel_ip => "127.1.4.2",
      :libvirt__tunnel_port => "10001",
      auto_config: false
  end

  config.vm.define "r3" do |node|
    node.vm.box = "cisco-iosv"
    node.vm.provider :libvirt do |domain|
      domain.management_network_mac = "52:54:00:0f:2b:95"
    end
    node.vm.network :private_network,
      :libvirt__iface_name => "g0/1",
      :libvirt__tunnel_type => "udp",
      :libvirt__tunnel_local_ip => "127.1.3.1",
      :libvirt__tunnel_local_port => "10001",
      :libvirt__tunnel_ip => "127.1.4.3",
      :libvirt__tunnel_port => "10001",
      auto_config: false
  end

  config.vm.define "sw1" do |node|
    node.vm.box = "cisco-iosvl2"
    node.vm.provider :libvirt do |domain|
      domain.management_network_mac = "52:54:00:34:76:32"
    end
    node.vm.network :private_network,
      :libvirt__iface_name => "g0/1",
      :libvirt__tunnel_type => "udp",
      :libvirt__tunnel_local_ip => "127.1.4.1",
      :libvirt__tunnel_local_port => "10001",
      :libvirt__tunnel_ip => "127.1.1.1",
      :libvirt__tunnel_port => "10001",
      auto_config: false
    node.vm.network :private_network,
      :libvirt__iface_name => "g0/2",
      :libvirt__tunnel_type => "udp",
      :libvirt__tunnel_local_ip => "127.1.4.2",
      :libvirt__tunnel_local_port => "10001",
      :libvirt__tunnel_ip => "127.1.2.1",
      :libvirt__tunnel_port => "10001",
      auto_config: false
    node.vm.network :private_network,
      :libvirt__iface_name => "g0/3",
      :libvirt__tunnel_type => "udp",
      :libvirt__tunnel_local_ip => "127.1.4.3",
      :libvirt__tunnel_local_port => "10001",
      :libvirt__tunnel_ip => "127.1.3.1",
      :libvirt__tunnel_port => "10001",
      auto_config: false
  end
end
Note how we modify the loopback IP address but keep the UDP port number the same for each virtual interface. You will see why in a moment.
Wireshark
After a vagrant up and applying the configuration to each device, let’s perform a packet capture on all links in our topology.
- Open the Wireshark application.
- Double-click Loopback: lo for the capture interface.
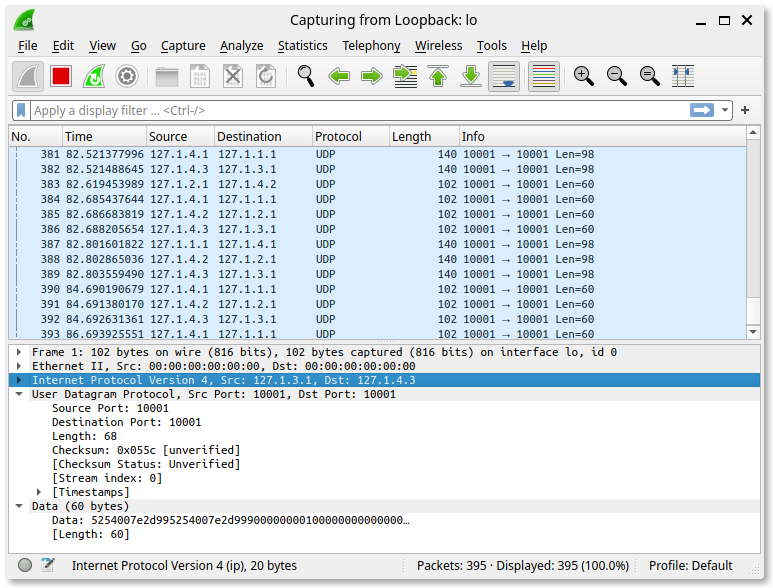
As expected, the output displays only the underlay UDP traffic. This is not what we want. We’re more interested in the overlay traffic passed between our Cisco devices, so how do we reveal it?
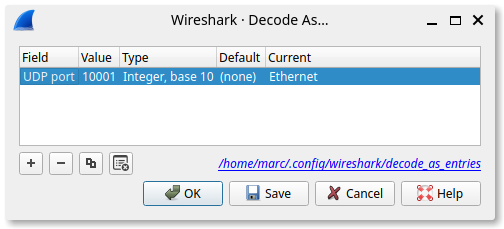
The Wireshark Decode As functionality lets you temporarily divert specific protocol dissections. We primarily want all traffic captured for UDP port 10001 to be decoded as Ethernet traffic.
- From the Wireshark menu, select Analyze.
- Select Decode As… from the dropdown menu.
- Click the + to add an entry.
- Select UDP port for Field.
- Enter 10001 for Value.
- Select Ethernet for Current.
- Click the Save button.
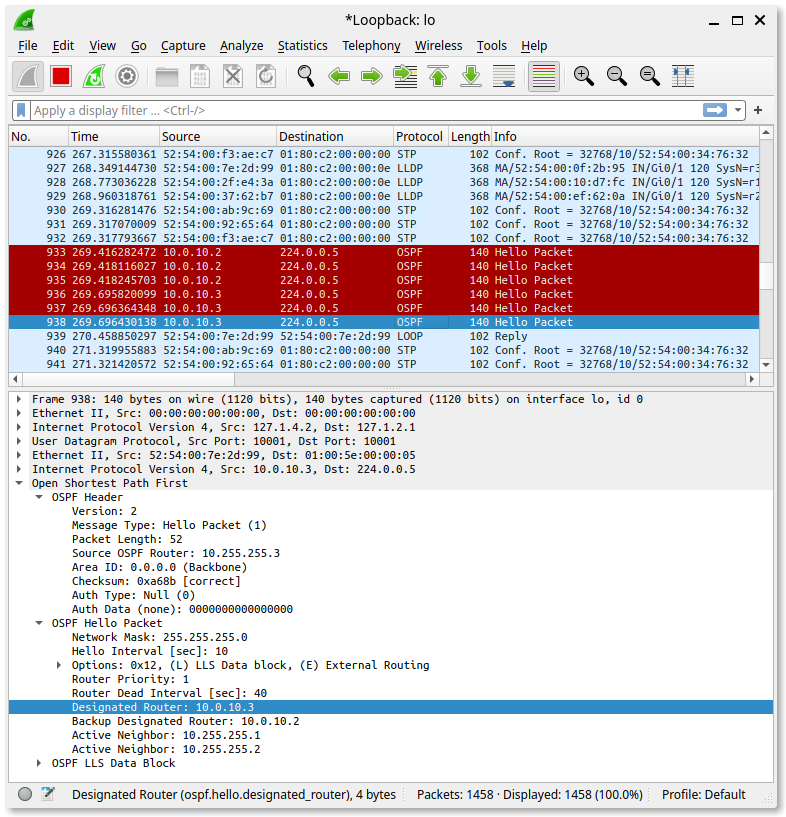
And automagically, Wireshark reveals all.
TShark
We can also set the decode in TShark . This comes in handy when we’re logged into a remote server.
tshark -i lo -d 'udp.port==10001,eth'